> ## Documentation Index
> Fetch the complete documentation index at: https://docs.go.gbgplc.com/llms.txt
> Use this file to discover all available pages before exploring further.
# View error insights
> Track and analyze errors occurring during customer journeys in GBG GO including error counts, rates, and affected sessions.
export const VersionWarningBanner = () => {
const [latestUrl, setLatestUrl] = useState(null);
useEffect(() => {
if (typeof window === "undefined") return;
const {pathname, hash, search} = window.location;
if (!pathname.includes("/go-v1/")) return;
setLatestUrl(`${pathname.replace("/go-v1/", "/go-v2/")}${search}${hash}`);
}, []);
if (!latestUrl) return null;
return ;
};
The *Error Insights* tab provides an analysis of errors occurring within a customer's journey. It helps you identify, track, and resolve technical issues, system failures, and processing errors that impact verification performance and user experience.
## Key metrics
The top section displays three main error tracking indicators:
* **Journey sessions with errors**: Shows the total number of journeys that encountered one or more errors during execution.
* **Error count**: Displays the total number of individual errors recorded across all journey sessions.
* **Journey error rate**: Presents the percentage of journey sessions that experienced errors.
## Errors encountered during journey session
This detailed table provides comprehensive error tracking organised by specific error occurrences and their context.
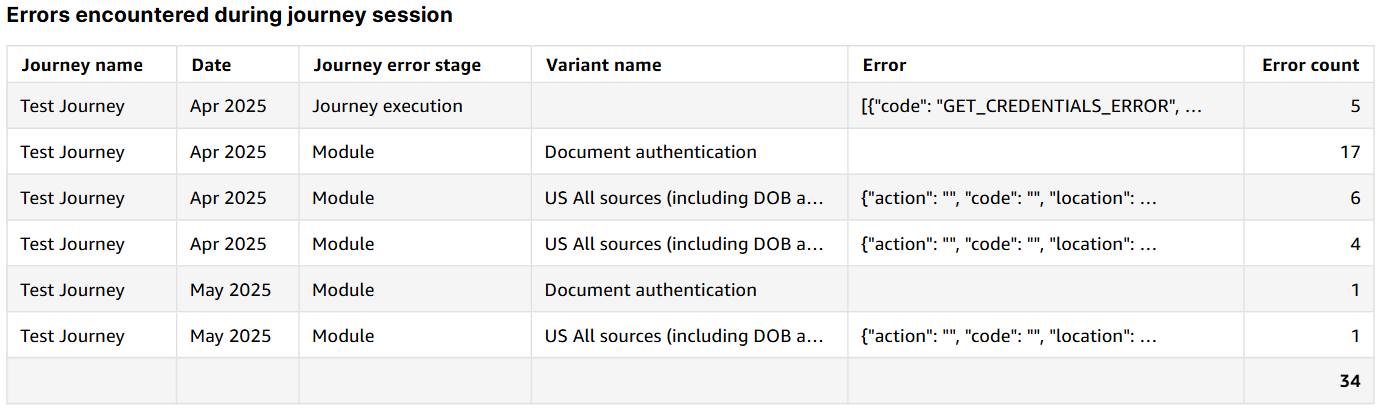 * **Journey name**: Identifies which journey workflow generated the error
* **Date**: Shows when the error occurred
* **Journey error stage**: Indicates whether errors occurred during journey or module execution
* **Variant name**: Specifies which module variant was executed when the error occurred
* **Error**: Provides the specific error message in JSON format
* **Error count**: Shows how many times this specific error occurred
## Errors by journey stage
This is a pie chart that provides a visual breakdown of where errors occur within the verification process.
## Monthly errors by journey stage
This is a bar chart displaying error trends across different time periods, organised by error stage.
## Ranked variant error occurrences
This is a horizontal bar chart that displays error frequency analysis for different module variants. This ranking helps you identify which module variants generate the most errors.
## Variant errors by journey name
This table provides journey-specific error analysis with filtering capabilities. The interface includes a variant selection list:
* **Journey name**: Identifies which journey workflow generated the error
* **Date**: Shows when the error occurred
* **Journey error stage**: Indicates whether errors occurred during journey or module execution
* **Variant name**: Specifies which module variant was executed when the error occurred
* **Error**: Provides the specific error message in JSON format
* **Error count**: Shows how many times this specific error occurred
## Errors by journey stage
This is a pie chart that provides a visual breakdown of where errors occur within the verification process.
## Monthly errors by journey stage
This is a bar chart displaying error trends across different time periods, organised by error stage.
## Ranked variant error occurrences
This is a horizontal bar chart that displays error frequency analysis for different module variants. This ranking helps you identify which module variants generate the most errors.
## Variant errors by journey name
This table provides journey-specific error analysis with filtering capabilities. The interface includes a variant selection list:
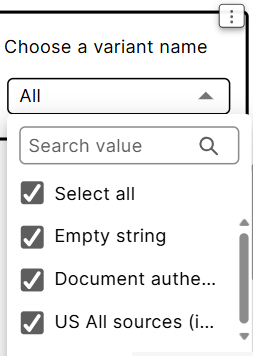 Choose a module or variant name to view the analysis and see how many errors occurred in a variant. You can also select one or more variants to view total error counts displayed by journey name. This helps you identify which journeys have higher error rates for specific variants.